The distribution of the shortest path through $n$ points
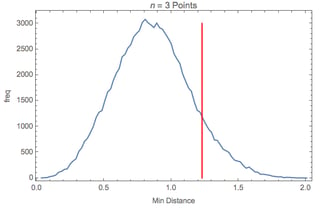
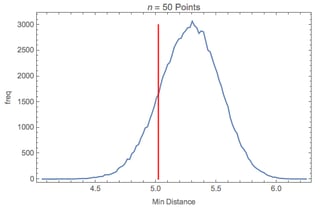
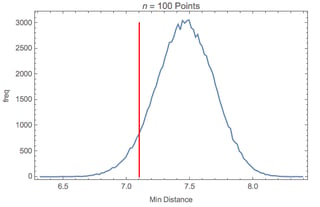
The following 4 diagrams plot the empirical distribution of the shortest path through $n$ points, when $n = 3, 20, 50$ and 100 (each simulated 100,000 times). The vertical red line denotes $0.71 \sqrt{n}$ on each plot.
- $n = 3$:
 [(source)](http://www.tri.org.au/se/nequal3plot.png)
- $n = 20$:
 [(source)](http://www.tri.org.au/se/nequal20plot.png)
- $n = 50$:
 [(source)](http://www.tri.org.au/se/nequal50plot.png)
- $n = 100$:
 [(source)](http://www.tri.org.au/se/nequal100.png)
Even when $n = 100$, the stated asymptote of $0.71 \sqrt{n}$ leaves a substantial component of the distribution in the left tail, to the left of the asymptote. Depending on whether you are interested in large or small values of $n$, an exercise such as the above will provide a simple way to select your desired $c$, to minimise any left-tail probability.
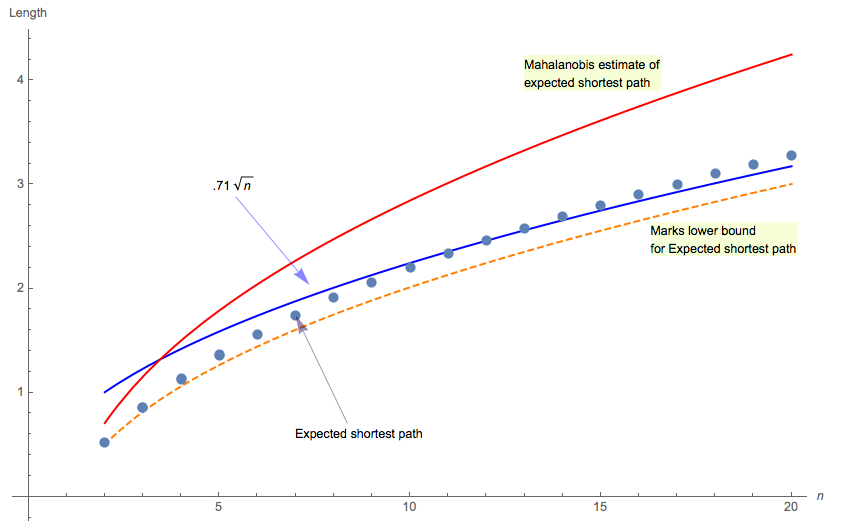
It is also apparent that using the distribution (or simulated distribution) is more helpful than just looking at expected values (or asymptotic expected values, or bounds on expected values of shortest paths), which is what most of the literature seems to do. For instance, the following diagram compares:
Marks (1948) lower bound for the expected shortest path: $\sqrt{\frac{1}{2}} \left(\sqrt{n}-\frac{1}{\sqrt{n}}\right)$
Mahalanobis estimate of the expected shortest path: $\sqrt{n}-\frac{1}{\sqrt{n}}$
The actual expected shortest path [ round dots ]
The OP's stated asymptote: $.71 \sqrt{n}$
 [(source)](http://www.tri.org.au/se/mahalanobisetimateexpectedshortestpath.png)
... but, for your problem, you really should be looking at the distribution ... not just the first moment.
