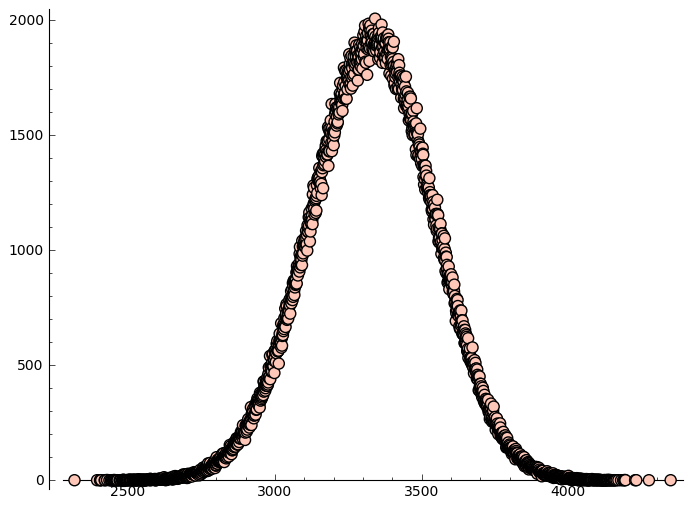
Here is a histogram for length 100. It seems to be normally distributed around $100^2 / 3$, which should put you on the scent, in spite of a complete absence of proof (see edit below).
This is not at all surprising, since if $x$ and $y$ are drawn uniformly at random from the interval $[0,1]$, the expected value of $|x-y|$ is $$ \int_{x=0}^1 \left(\frac{x^2}{2} + \frac{(1-x)^2}{2}\right) = \frac 13. $$ Maybe turning this fact into a proof is very straightforward; maybe it is tricky.
Edit: I should note that the expected value of $(n^2-1)/3$ actually is very easy to prove; it is just the distribution that might be tricky.
Let $n$ be very large. OneOne way to generate a random permutation $\pi$ is to choose $n$ reals $r(i)$ uniformly at random from $[0,1]$. Now, what is the expected value of $|\pi(i) - \pi(i+1)|$? It is simply the expected number of $r(j)$ between $r(i)$ and $r(i+1)$, plus one. Because the expected difference between $r(i)$ and $r(i+1)$ is $1/3$, this is $1+(n-2)/3$, or $(n+1)/3$. Since we compute this for $n-1$ consecutive pairs, linearity of expectation tells us that the expected sum is $(n-1)(n+1)/3$, or $(n^2-1)/3$.

